- 1
-
-
Bioregional Mapping
Explore creation of a mapping guild and spin off project groups. Manages the mapping page of the RC website
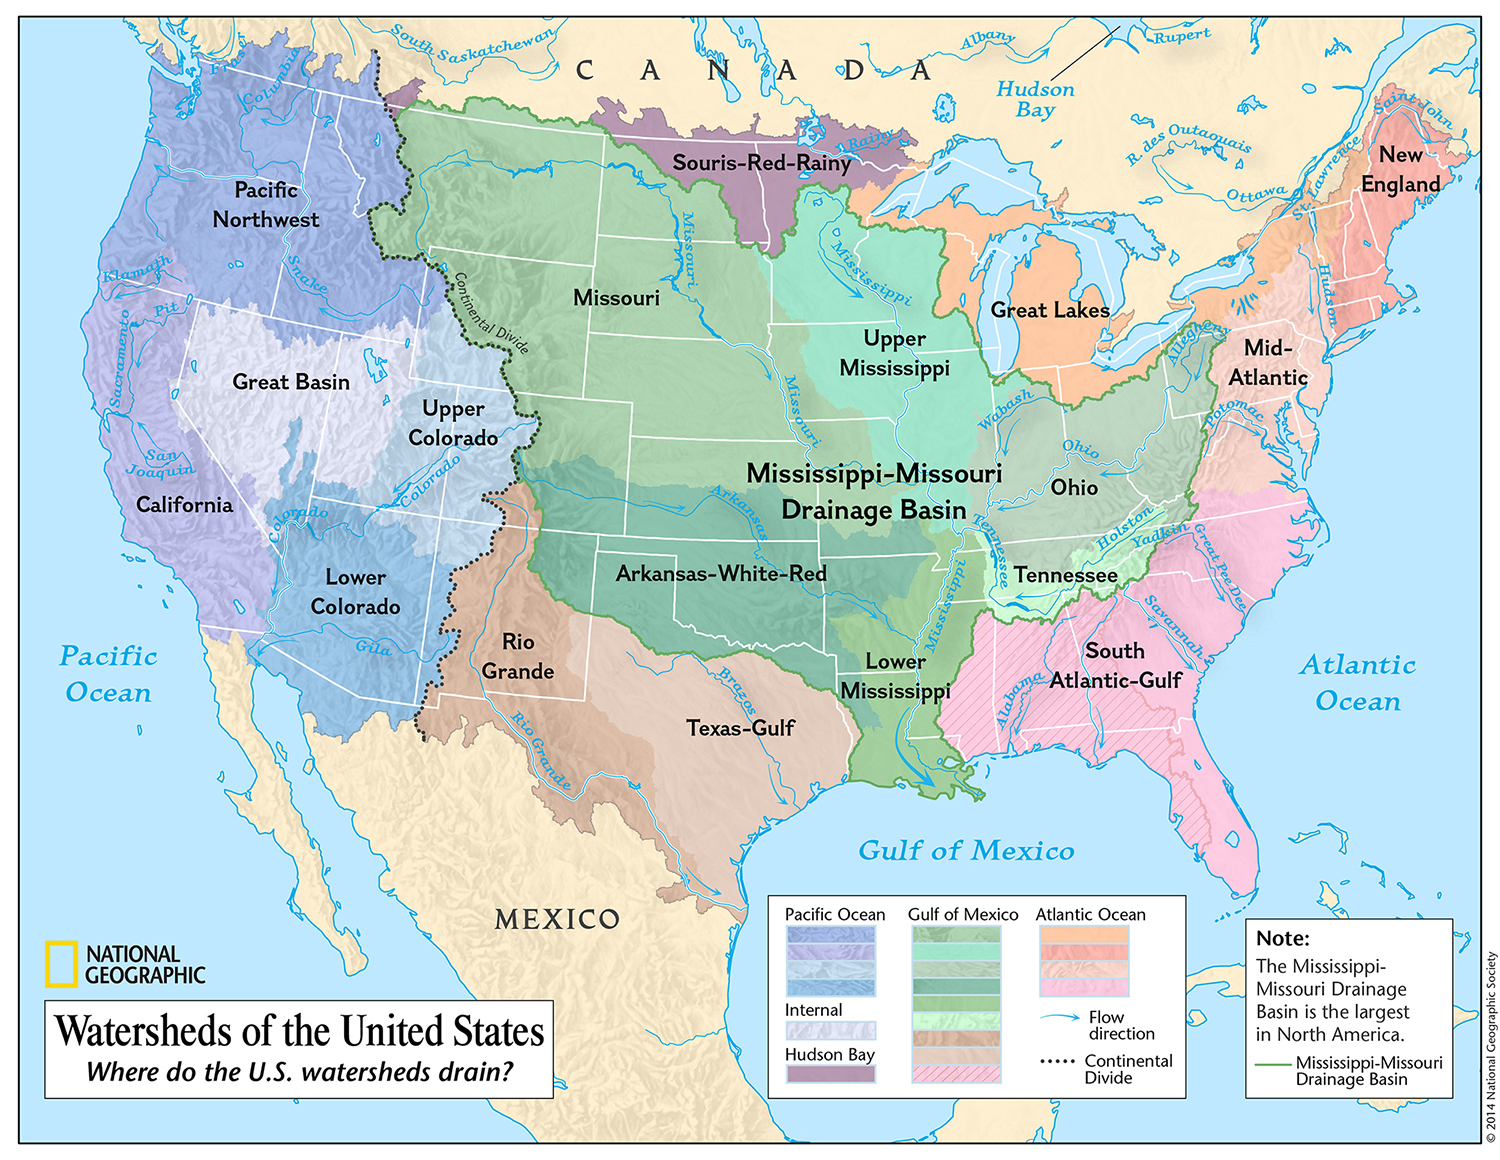
Map of Cascadian Soils
-
Map of Cascadian Soils
Hey folks,
I am currently creating a soil type layer for the Cascadia Bioregion. This may start simple and become more in-depth over time as more accurate data is obtained. Let’s ask ourselves what ideal details would we include to give insight to other layers we’ll want to include in the Bioregional atlas down the road?
Here is a layer we created for our Geodatabase project. As you can see, some of our north central Cascadian data is incomplete and we had difficulty symbolizing a layer with over 150k unique soil classes. So I am striving for something much simpler which will allow for us to integrate this data with other attributes about our local watersheds and bioregion as a whole.
Cheers,
Cameron

Log in to reply.
